Ultrasonics sensors for position and level detection
Ultrasonic sensors detect all sound-reflecting objects and measures the time from transmission to reception of a sound signal. The target's color, transparency and surface reflectivity are irrelevant. ifm offers variants in M18 and M30 designs with sensing range up to 8 m.
The perfect solution for challenging surfaces
With the IO-Link enabled version, setup is achieved in a few minutes using the moneo | configure software on a laptop or the moneo | blue app that runs on a mobile device.
| Description | Learn More | |
|---|---|---|
 |
Ultrasonic sensors detect all sound-reflecting surfaces Typical photoelectric sensors can struggle with certain applications where target color, transparency and reflectivity vary. ifm's ultrasonic sensor provide reliable position and level detection without regard to the target characteristics. Using IO-Link, the distance value is transmitted to the nearest millimeter. |
 |
 |
Full-metal ultrasonic sensors are extremely robust From the diaphragm to the connector, these ultrasonic sensors are completely enclosed in 316L stainless steel, making them resistant to external influences and extending their life-in-service. |
|
| Sensor type | Sensing range | Output | Points to consider |
|---|---|---|---|
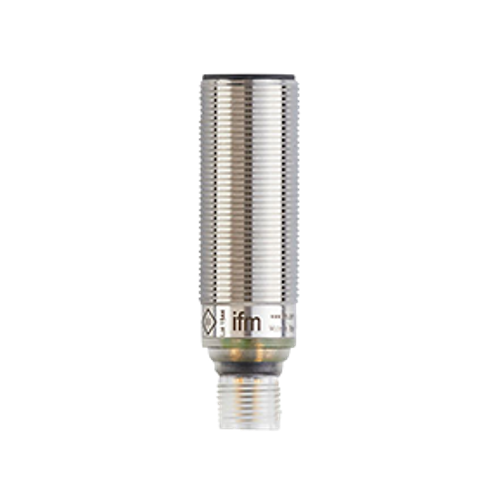
Short body M18 x 60 mm |
Up to 1200 mm | • DC PNP / NPN • Analog • IO-Link |
• Industry standard M18 housing • 60 mm housing length • Stainless steel and plastic housing available |
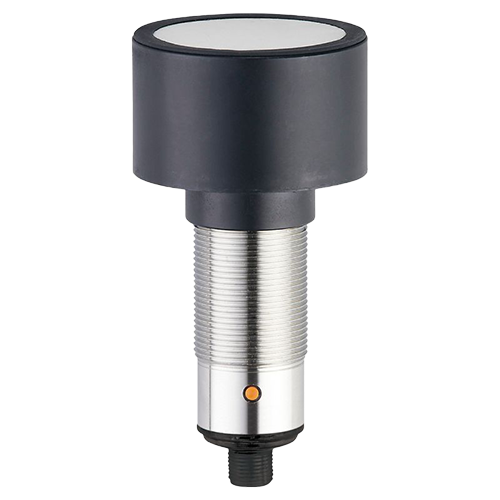
Long body M18 x 98 mm |
Up to 2200 mm | • DC PNP / NPN • Analog • IO-Link |
• Industry standard M18 housing • 98 mm housing length • Stainless steel and plastic housing available • Retro-reflective versions detect objects regardless of orientation |
Cube style M18 x 38 x 53 mm |
Up to 1200 mm | • DC PNP / NPN • Analog • IO-Link |
• Space-saving housing design • M18 threaded nose or through holes for mounting |
| Sensor type | Sensing range | Output | Points to consider |
|---|---|---|---|
M18 short body |
Up to 1200 mm | • DC PNP / NPN • Analog • IO-Link |
• Industry standard M18 housing • 60 mm housing length • Stainless steel and plastic housing available |
M18 Long body |
Up to 2200 mm | • DC PNP / NPN • Analog • IO-Link |
• Industry standard M18 housing • 98 mm housing length • Stainless steel and plastic housing available • Retro-reflective versions detect objects regardless of orientation |
M18 Cube style |
Up to 1200 mm | • DC PNP / NPN • Analog • IO-Link |
• Space-saving housing design • M18 threaded nose or through holes for mounting |
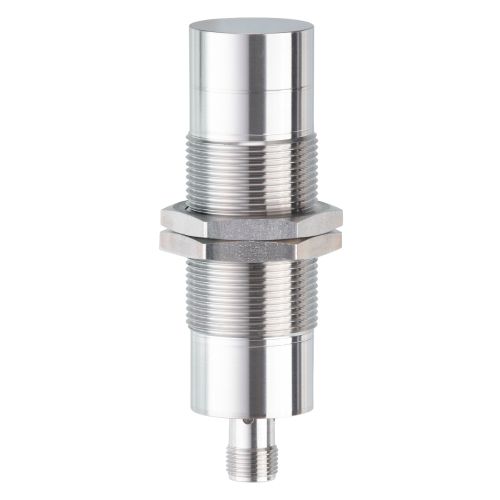
 M30 full metal |
Up to 2500 mm | • DC PNP / NPN • Analog • IO-Link |
• All metal stainless steel sensing face for robustness in harsh environments • Industry standard M30 stainless steel housing • Longer range requires larger sensing head • 103 mm housing length |
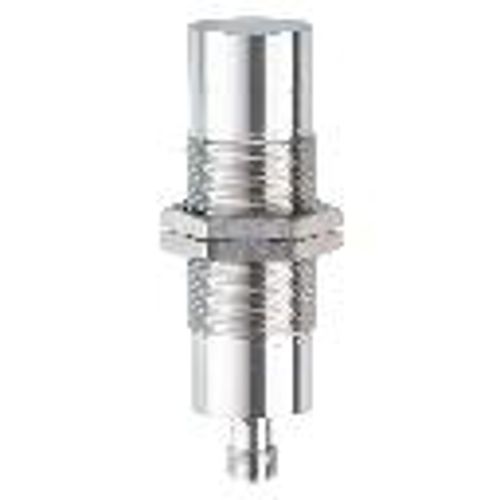
 M30 |
Up to 8000 mm | • DC PNP / NPN • Analog • IO-Link |
• Industry standard M30 stainless steel housing • Longer range requires larger sensing head • 118 mm housing length |
Ultrasonic sensors detect all sound-reflecting objects and measures the time from transmission to reception of a sound signal. The target’s color, transparency and surface reflectivity are irrelevant.
Operating principle
An ultrasonic sensor consists of:
- Transducer
- Oscillator (stimulates the transducer)
- Driver unit
- Repeater
- Comparator (digitizes the signal)
- Clock-pulse generator

For operation, the transducer is stressed by high voltage. This causes the transducer to vibrate due to the piezo-electric effect and transmit a sound burst into the air. At this point, the clock-pulse generator switches the sensor to receive mode and time measurement begins. When the sound burst hits the target, an echo is reflected back at the transducer. The echo of the sound burst causes the transducer to vibrate due to the piezo-electric effect and time measurement stops.
Distance to the target is calculated with the time measurement using the equation:
d = c * t / 2 where
d = distance (m)
c = speed of sound (m/s)
t = time (s)
Ultrasonics transducer construction
![]()
- Piezo-element sends and receives sound (200…400 kHz range).
- Mounting with integral foam allows the piezo-element to vibrate freely.
- Fixture.
- Adaptation layer matches the acoustic impedance between air and the piezo-element.
- Sound waves
This chart rates the performance of various technologies with certain influences.
| inductive | capacitive | photoelectric | ultrasonic | |
|---|---|---|---|---|
| temperature | ||||
| moisture | ||||
| dust on sensor surface | |
|
||
| extraneous light | ||||
| noise | |
|||
| color/transparency | |
|||
| distance to object | low | low | high | high |
| strong air turbulence |
1) e.g. thin, clear-transparent film/glass 2) if no mutual interference 3) if non-conductive 4) if not too thick
Often, the question comes up “Should I use a diffuse photoelectric sensor or an ultrasonic sensor?" The following chart dives more deeply into this question.
| application/targets | time of flight (laser) | diffuse opto (red light) | diffuse BGS opto (red light) | ultrasonic (diffuse) | ultrasonic (retroreflective) |
|---|---|---|---|---|---|
| shiny objects | |||||
| irregular objects | |||||
| objects with holes | |||||
| transparent objects | |||||
| transparent liquids (open vessel) | |||||
| transparent films | |||||
| large area one single | |||||
| angle to the target | |||||
| different color targets | |||||
| distance to ground (sprayer) | |||||
| level of irregular objects (seeds, potatoes) | |||||
| long range (>1m) BGS |