moneo IIoT platform
Start small, validate value, scale with confidence
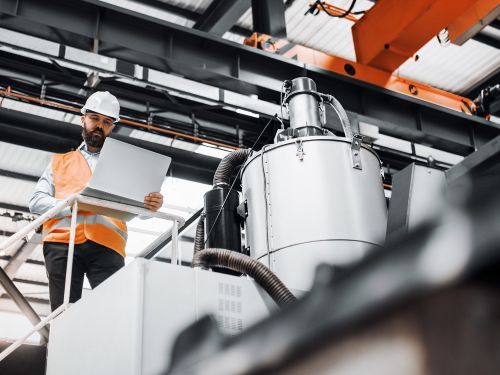
You don’t need a full system overhaul to get results. Using our machine health monitoring, you can detect early signs of wear and prevent unexpected failures.
With real-time sensor data analysis, you gain clear insights into equipment performance, helping you act before issues escalate. And with our equipment preventive maintenance software, you can schedule interventions proactively, avoiding costly downtime.
Protect your systems – simply, digitally, cost-effectively
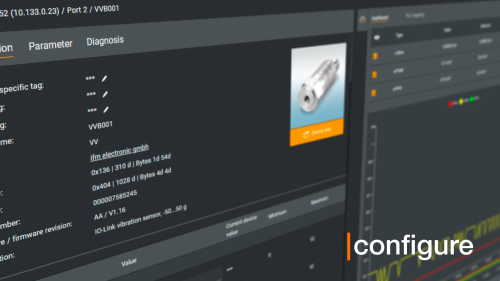
Monitor machine status in real time with machine health monitoring, improve process efficiency, and reduce unplanned downtime. Our plug-and-work platform connects directly to industrial IoT sensors for fast, PLC-independent deployment and open integration.
Increase your machine availability
Prevent unplanned downtime and improve reliability using machine health monitoring.
Ensure process quality
Detect deviations in real time using sensor data analysis to maintain consistent quality.

Optimise your energy consumption
Track and reduce usage at the machine level with moneo’s equipment status dashboard.
Get started now in 3 simple steps

Get inspired
Kickstart IIoT
|


Discover how you can optimise your added value independently and easily every day with moneo
Use industrial IoT solutions to connect people, processes, and data – and act on real-time insights through machine health monitoring and sensor data analysis.
ifm’s contribution to Industry 4.0
At ifm, we believe that your path to smart manufacturing should be easy to implement, without the need for expensive consulting and long test phases. We are therefore committed to the following principles:
Industry 4.0 projects should offer clear and measurable benefits for manufacturing.
The technology should be “plug and work” and involve minimal effort so that customers can quickly reap the benefits.
Hardware and software should be easy to implement without requiring specialist expertise and integration consulting.
The system architecture should be “open” for communication with the most important hardware and software platforms.
No-code software solutions are ideal for shortening the time to market of Industry 4.0 projects
Proof-of-value projects can enhance project definition and add value that results in a faster return on investment.
Good to know
Cooperation
ifm is a driver of innovation through involvement in top consortia and alliances
Cyber security
Cyber security is critical to the secure digitalisation of industries.
ABC – IIoT
Discover the exciting world of the Industrial Internet of Things (IIoT).
Trade fairs
ifm is present at trade fairs worldwide. Join us there. We look forward to your visit.
Success stories and use cases
Find out how ifm has helped customers improve their production plants in real time.