- Real-time maintenance
- Vibration
- Technology
- Time domain
Time domain
Every rotating machine has its own vibration signature made up of the combined individual parts. The amplitude of that signature changes when the machine experiences unusual operation, such as unbalance or bearing wear.
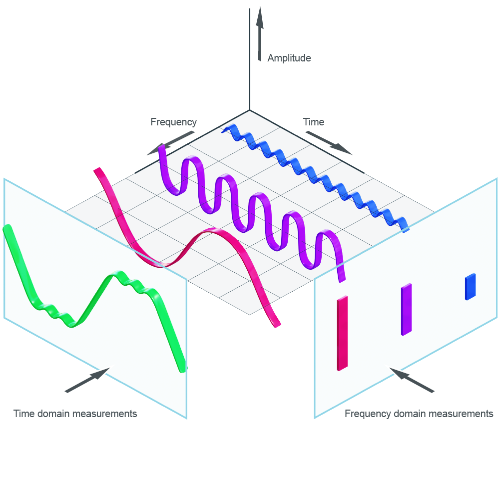
- Vibration in the time domain is the overall vibration of the machine. It’s what you feel when you put your hand on the machine and it is the combination of each component.
- Vibration in the frequency domain isolates each of the individual components. This allows you to pinpoint sources of defects before the machine catastrophically fails.
To illustrate time and frequency domains, consider an orchestra made up of many different instruments. Each musician is playing an instrument with a specific part. This represents the frequency domain shown in the red, purple and blue waveforms in the image below. The overall sound from the orchestra is the sum of all individual instruments and is represented by the green line in the image.
- Time domain monitors signal amplitude over time.
- Frequency domain monitors signal amplitude by frequency
Effective velocity (v-RMS) and acceleration (a-RMS)
In statistics, RMS (root mean square) is the square root of the average over time of the individual squared values measured during the time in question.
In vibration monitoring, v-RMS and a-RMS are measurements commonly used in the time domain for overall machine vibration. These measurements are used for:
- Resonance
- Chattering
- Gear mesh wear
- Etc.
The image below show measurements in the time domain (of either velocity or acceleration). The highlighted areas indicate the RMS value during a specified period. Note, because RMS uses the square of the measured value, it is always a positive value.

Peak acceleration (a-max)
Similar to RMS values, peak acceleration is a measurement of overall vibration, but it is the absolute highest (or lowest) values recorded during the period. The highlighted areas in the image below indicate the peak values. The measurements are used for:
- Crash detection
- Rubbing
- Bearing damage already incurred
