- moneo: IIoT platform
- Use cases
Temperature monitoring in a CIP plant
A CIP set is a process plant commonly found in the food and beverage industry, which undergoes cleaning in place (CIP). When processing biological substances destined for consumption, such as milk, strict hygiene is vital to prevent the introduction of harmful germs that could endanger the health of consumers. In most cases, the containers (usually tanks) are too big to be disassembled for cleaning. A CIP cycle consists of several necessary hygienic process steps. The temperature and duration of heating are decisive to achieve optimal cleaning results – comparable to the hot water cycle of a washing machine. To ensure a complete cleaning process, the required parameters (temperature) must be reached within the entire plant. Otherwise, the costly process would have to be repeated (energy, chemicals and production loss).
![]()
Initial situation:
ifm performs tests with process sensors in a real environment using their own CIP plant. Before moneo was introduced, the plant was operated via analogue signals and controlled via a PLC. Conducting analyses via the PLC proved difficult. The process could only be visualised directly on the HMI of the plant and parameter setting was only possible directly on the sensors. Surveillance was restricted to the analogue 4...20mA signal value.
![]()
Aim of the project:
The focus was on recording and analysing the temperature data. The temperature at the inlet and outlet of the plant was to be measured to determine the temperature difference. This is considered a reliable indicator of whether the desired process temperature has been reached, which is crucial when disinfecting the plant using heated cleaning solutions If the temperature is nearly identical at the two points, it can be assumed that all areas have been disinfected successfully.
The existing PLC remains unchanged. With the plant’s expansion, the data will be transferred to moneo RTM via IO-Link devices.
![]()
Implementation:
moneo was installed on an existing central server of ifm prover to activate the required modules, including moneo RTM.
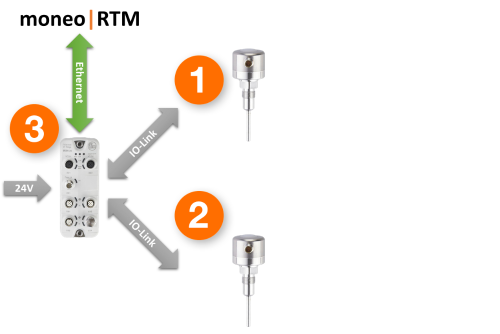
To detect the values at the inlet and outlet, two temperature sensors with self-monitoring function were installed and connected to an IO-Link master with IoT port. After integration of this master into the company network via Ethernet, the process values of the sensors are automatically transferred to moneo RTM every second.
Further IO-Link devices can be added to the system at any time to collect and evaluate additional process data thanks to the scalability of the software.
![]()
Result:
The software calculates process values such as the temperature difference. This makes it possible to determine whether the disinfection has been successful or if further action is required. The system expansion means that the data can now be recorded without any gaps. Data analyses help to optimise processes and increase plant uptime.
![]()
Bottom line:
The plant was digitised successfully without any changes or interventions to the existing PLC or software.
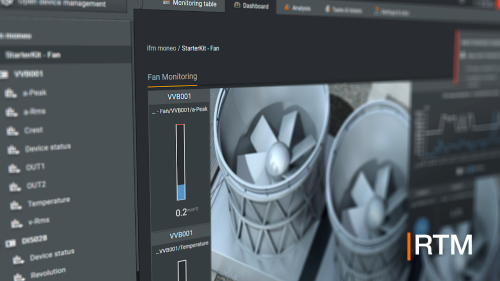
Dashboard
Relevant sensor information can be visualised quickly and individually via the smart dashboard. Preconfigured instruments, such as thermometers or line diagrams, help to graphically visualise current process values. Images in standard formats (PNG, JPEG, GIF...) can be directly uploaded to the dashboard. Users can easily navigate between different dashboards using the navigation markers.
The following image shows the dashboard visualisation of the full plant. The navigation markers link directly to other dashboards, which provide further details on the relevant area:
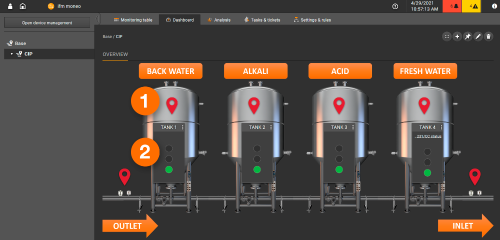
- Navigation object linking to other dashboards
- Traffic light display for status indication of tanks 1 to 4
The dashboard visualises the inlet and outlet temperature. In addition, the temperature difference between the sensors has been determined with the help of the Calculated Values function and is visualised as a thermometer and line diagram.
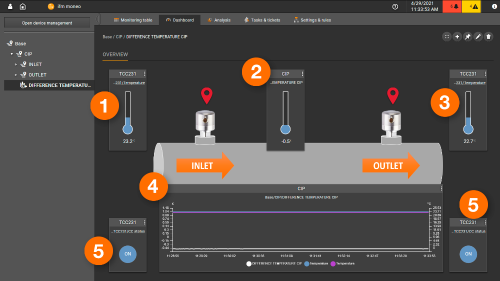
- Temperature in the inlet
- Temperature difference between inlet and outlet
- Temperature in the outlet
- Diagram with inlet, outlet and differential temperature
- Current calibration status of the TCC
Analysis
This function can be used to analyse the captured data further and analyse the process in more detail, e.g. to determine the rinsing times and adjust them if necessary. Since moneo RTM automatically logs information as soon as the sensors are activated in the topology path, data is immediately available.
The analysis below shows the heating process. The temperature sensor in the inlet (1) indicates small temperature fluctuations, which are caused by the control of the steam heat exchanger. The temperature in the outlet follows this rising curve with a delay.
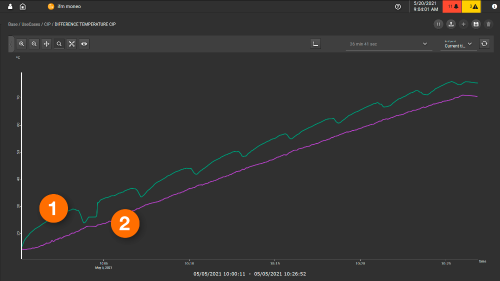
- Temperature in the inlet
- Temperature in the outlet
Using drag & drop, analyses can be custom produced, enabling combination and joint analysis of different process values (e.g. temperature or conductivity).
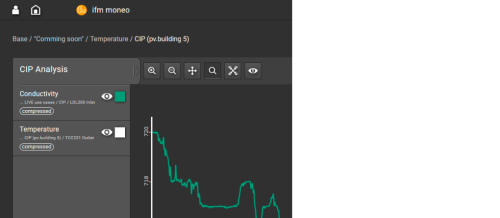
In addition, it is possible to export data records for further analysis or process documentation.
Example of an exported CSV file:
Key_Path;Base / CIP / INLET / TCC231 / Temperature
Key_DeviceName;Temperature
Key_DataSource;Temperature
Key_Unit;°C
Key_DataType;raw
Key_DataCount;4
Timestamp;RawValue
2021-04-29T16:05:06.722+0200;23.42
2021-04-29T16:05:07.719+0200;23.42
2021-04-29T16:05:08.720+0200;23.42
2021-04-29T16:05:09.721+0200;23.42
Tasks & tickets / limit values
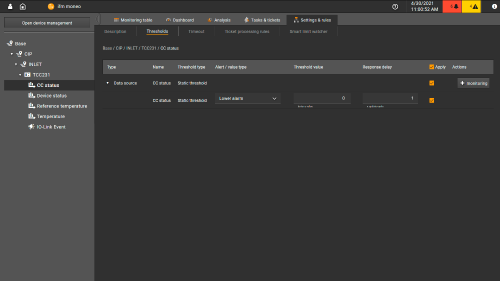
The temperature sensor used (TCC) features a calibration check function. It uses two thermally coupled sensor elements (measuring and reference element) to automatically detect a temperature difference. The process value is provided by the sensor via the analogue output. The reference value is used for comparison purposes and to verify the process value. If the temperature difference between the process value and the reference value exceeds the value set as calibration check limit [ccL], the CC status is set accordingly (0 = calibration check warning message, 1 = normal operation). It is monitored whether the process value is below the threshold. If the CC status is 0, an alarm ticket is generated.
An alarm can also be triggered if the difference in temperature is too high. This is an indication that the cleaning process cannot be completed successfully.
Combined thresholds
Thresholds can also be set for calculated values. The calculated value in this example is used to monitor the current temperature difference as a function of the temperature at the inlet. It is checked whether the temperature in the inlet exceeds 80°C (5). If it is below 80°C (5), the value of 20°C (6) is provided; if it is above 80°C, the current temperature difference between the inlet and outlet (6) is output.
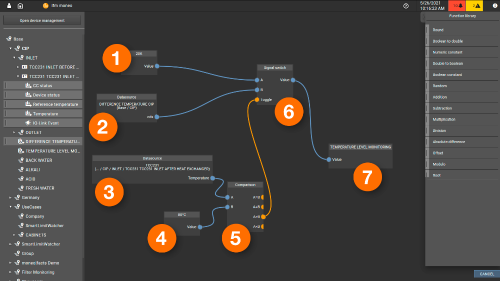
- Temperature value in inlet <80°C (20K)
- Temperature difference between inlet and outlet
- Temperature in the inlet
- Comparison value for inlet temperature (80°C)
- Comparison function block
- Signal switch function block
- Temperature output (< 80°C = 20K; > 80°C = current temperature difference)
This calculated value can now be used for plant monitoring. For this purpose, warning (1) and alarm (3) thresholds are set. If the temperature in the inlet is greater than 80°C and the temperature difference is greater than 5K (1) or greater than 10K (3), a corresponding message is generated. As the temperature reacts fairly slowly due to the process, a response delay is added (2 / 4). One update cycle corresponds to approx. 1 second. For example, in this setup, a warning is triggered if the temperature difference of 10 K is not reached after 300 seconds (5 min). If the difference of 5 K (3) is not reached after 600 seconds (10 min), an alarm is triggered.
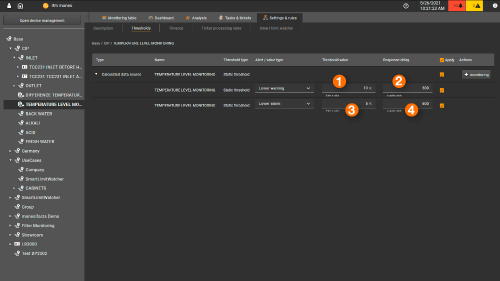
- Temperature warning thresholds
- Response delay warning
- Temperature alarm thresholds
- Response delay alarm
Manage ticket processing rules
This function can be used to configure what happens in the event of a warning or an alarm in addition to ticket creation. In the present case, a group of recipients in the maintenance department is informed that the calibration check function of the sensor has been triggered. This enables them to react quickly and initiate a calibration.
Calculated values
Using the calculated values function, process values can be further processed and used for calculations. In the case of the CIP plant, the function is used to determine the temperature difference between inlet and outlet.
Temperature difference [∆T]= ambient temperature [T2] - temperature inside control cabinet [T1]
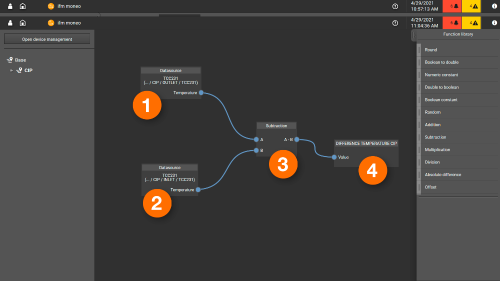
- Inlet temperature [T2]
- Outlet temperature [T1]
- Function block: subtraction
- Temperature difference [∆T]