Monitor central ventilation air filters
The central ventilation system at ifm prover gmbh is to be monitored. This includes the filters for the air supply and exhaust as well as the filters of the workstation exhaust system on the ground floor and the first floor. In principle, filters are, in simplified terms, a resistor in a system. Foreign particles that do not belong to the medium clog the open meshes or pores of the filter. This increases the total resistance. For this reason, the flow rate decreases while the pressure remains constant. The performance of the system is increasingly impaired as a result. This can be bridged up to a certain point by increasing the conveying pressure, which, however, also increases the energy requirement. Depending on the required filter performance, it must be considered and decided on a case-by-case basis when is the ideal time to replace the filter.
Use cases for filter monitoring in the production process:
- Product and process quality assurance
- Optimize energy consumption
- Maintenance organization
- Meet air quality requirements (fine dust, air purity, extraction efficiency)
The initial situation: Regularly scheduled replacement
Maintenance of the ventilation filters took place at fixed time intervals. No central monitoring existed and no alerts (email, ticket) were issued when a filter change was necessary. The current condition was only visualized locally by a device on the filter. As a result, the filter was either replaced prematurely or too late. This entailed additional operating costs for filter replacement, disposal, energy consumption and downtimes. An analysis, e.g. to optimize fault detection (filter breakage, no filter installed, clogging) was not possible due to the lack of data. Potential for improvement was identified in the storage of history data.
Goal of the project: Predictive condition-based replacement
Implement a needs-driven filter replacement strategy and shift from time-based to condition-based maintenance. This optimization was to be achieved through automated monitoring and visualization of the filter condition.
A defined group of email recipients in the maintenance department was to receive a filter replacement notification, with filter changes only taking place when necessary due to their condition. In order to be able to identify further optimization potentials, the aim was to enable users to analyze the data.
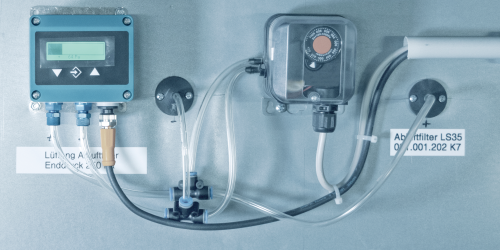
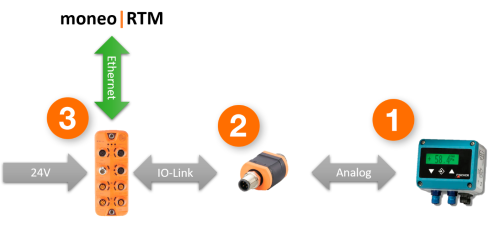
Implementation: Filter differential pressure measurement
At ifm prover gmbh, moneo RTM is centrally installed on a server. The IO-Link master is connected to the server via an internal VLAN and the sensors are connected to the master via IO-Link. A differential pressure sensor with an analog output was installed at the filter. The signal is read by an IO-Link converter (DP2200), converted into an IO-Link process value and transmitted to the IO-Link master with IoT interface (e.g. product AL1350).
moneo RTM cyclically registers the process values via this IO-Link master. The analog current values received in this way are further processed via the "Calculated values" function by converting them into a process value in the unit Pascal. This process value corresponds to the actual sensor.
The thresholds for a filter change were taken from the data sheet of the relevant bag filter and configured as limit values in moneo RTM. In order to prevent critical situations from occurring, a corresponding user group is stored in the ticket processing rules area, which is notified when limit values are exceeded in order to be able to initiate a filter change.
The result: Extended filter life and reduced unplanned downtime
The introduction of permanent filter monitoring led to an internal process optimization, from time-based to condition-based maintenance. By detecting faults in good time, machine uptime was secured and quality increased.
Timely alerting in case of necessary filter changes (email, ticket) increased the process quality. The environmental impact and the operating costs (energy, maintenance, material) were sustainably reduced by the new maintenance strategy.
By documenting the maintenance work and storing history data, analyses of possible optimizations of the filter system can be carried out in the future, as sufficient data material is available. Maintenance staff have an application at their disposal that can be easily adapted to customer-specific conditions and that allows process values (differential pressure, conversion of specific units) to be calculated. The use of moneo RTM has already prevented consequential damage to machines and extraction systems.
Bottom line: Value added services with moneo
- Overview and detailed information on the installation on the dashboard
- Recording of data for further optimization
- Possibility to analyze data recording
- Permanent monitoring of the filter condition
- Email notification in case of threshold violation
System structure
- Differential pressure sensor with 4…20mA output
- Evaluation system and display for analog signals 4...20 mA (DP2200)
- IO-Link master (AL1350)
Dashboard
Get the big picture on the moneo dashboard. The current plant status can be easily monitored with the traffic light display. In this case, the four monitored filters are clearly displayed and quickly provide an overview of the current status.

Another dashboard was created in which different visualization tools are used to show the current parameters of a single filter in detail.
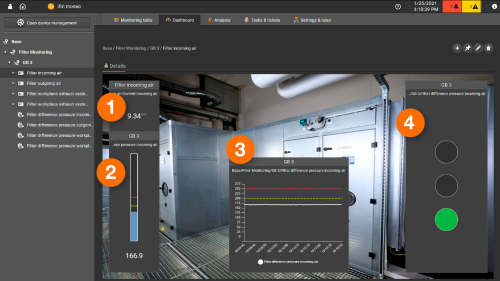
- Raw analog value of the differential pressure sensor in mA
- Calculated differential pressure in Pa
- Differential pressure displayed over time
- Traffic light display of the current filter state
Analysis
The analysis can be used to view further details. The operating times of the plant can be analyzed retrospectively when a long-term evaluation is carried out.
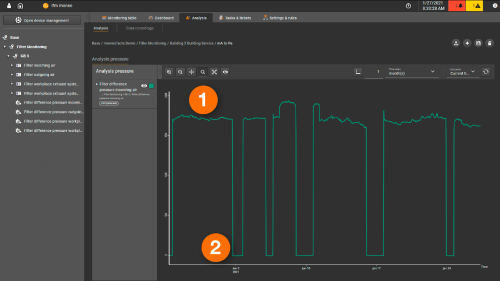
- Plant in operation
- Plant not in operation
Through various evaluations, trends can be identified in a very short time. In this case, for example, the differential pressure of all four filters was observed over two days. The visualization shows that the filter of the exhaust system on the 1st floor (purple line) is slowly clogging as the differential pressure is slowly increasing.
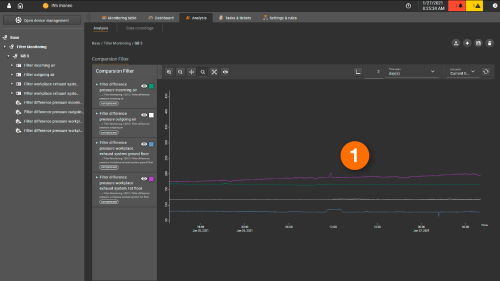
- Purple line, differential pressure filter exhaust system 1st floor
Tasks & tickets: start/stop thresholds
Manage thresholds
This function in moneo RTM allows users to define an individual threshold for each process value. In this application, thresholds are set such that maintenance personnel will be notified in good time when a filter change is necessary.
When the warning threshold is reached, the personnel is informed about the required filter change and can schedule it accordingly. The parts must be replaced at the latest when the alarm threshold is reached.
During the start-up phase of fans, overshoots often occur and thresholds are briefly exceeded. To avoid false alarms or warnings caused by brief overshoots, a response delay can be set.
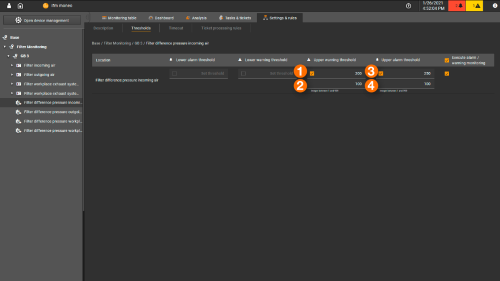
- Upper warning threshold
- Delay time for the warning threshold
- Upper alarm threshold
- Delay time for the alarm threshold
Manage ticket processing rules
The ticket processing rules wizard can be used to define simple warning and alarm rules. In the example below, a group of email recipients in a building services department is notified when warning and alarm thresholds are reached and a filter change is imminent or urgently recommended.
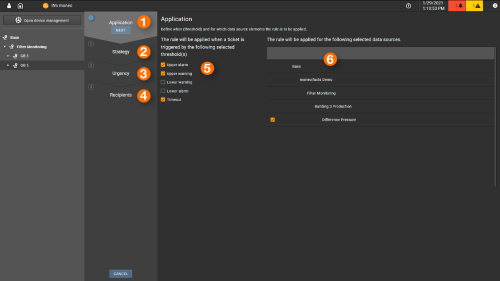
- Definition of thresholds (5) and data sources (6)
- Defines which rule is applied
- Defines the warning or alarm urgency
- Defines the email recipients
- Definition of the relevant thresholds
- Definition of the corresponding data sources
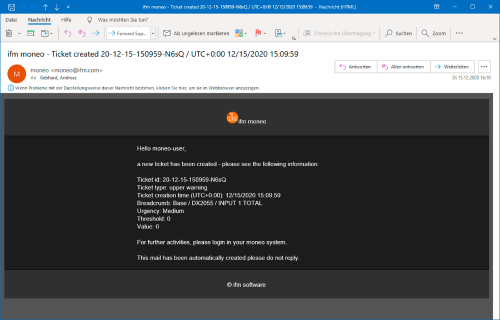
The email generated from within moneo already contains ticket information:
- Affected data source
- Value that was exceeded or not reached
- Ticket priority
- Timestamp
Calculated values
The “Calculated values” function is used to further process the process data. In this use case, the analogue current signal provided by the sensor is converted into a pressure value in the unit pascal. A value of 4mA corresponds to 0Pa and a value of 20mA equals 500Pa.
Pressure difference [Pa] = pressure difference as analogue current value [mA] - 4mA * (500 Pa / 16 mA)
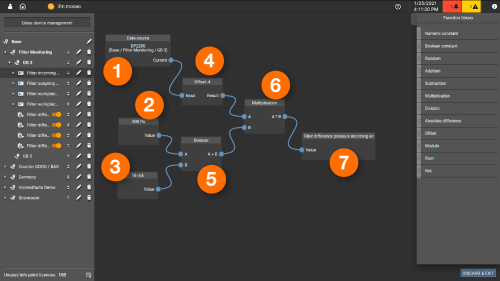
- Pressure difference as analogue current value from sensor (4...20mA)
- Maximum measuring range of the sensor (500Pa = 20mA)
- Current span analogue value (20 mA - 4 mA = 16 mA)
- Offset analogue value (4...20 mA to 0...16 mA)
- Calculation of factor for current to pascal
- Multiplication of current value (0...16 mA) with factor
- Result pressure difference in pascal (Pa)