Increase energy efficiency through targeted compressed air monitoring
Identify and optimise your compressed air costs
Goal of the project
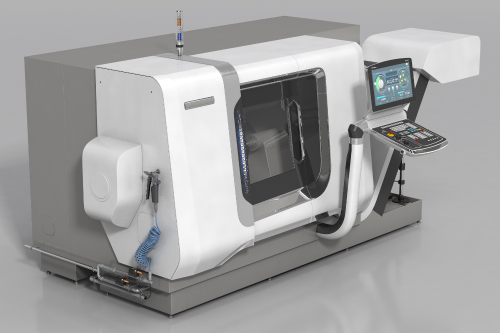
Compressed air is the most expensive form of energy used in production. It acts as a versatile energy source in numerous production areas, especially in machine tools. It is also used to transport materials or as a cleaning agent and to cool sensitive plastic parts.
However, producing compressed air generates enormous energy costs. Frequently occurring leaks in the machine also result in high, avoidable costs. The careless use of compressed air guns for cleaning in workplaces is another cost driver in manufacturing.
Complete solutions offered by ifm consisting of high-quality sensors and the IIoT platform moneo make it possible to identify the actual amount of compressed air used and then transparently map avoidable incorrect use and losses.
Targeted monitoring, visualisation of consumption and then the effective use of compressed air help to considerably reduce avoidable costs.
Transparent |
Identification of |
Prevention of |
|
On average, customers achieve: |
||
|
100% Cost allocation |
up to € 3,000 Savings through targeted |
100% ROI after 1.1 years |
Advantages of sustainable compressed air monitoring
Would you like to visualise your energy savings potential, make your processes as efficient as possible and avoid any unnecessary costs? Air plays a major role in production processes; it is both a valuable and an expensive resource. To simultaneously ensure the quality of your product and sustainably reduce the energy costs of using compressed air, it is necessary to make the machine tool as energy efficient as possible and take the further use of compressed air in the facility into account.
The IIoT platform moneo makes it possible to create a calculation based on sensor values that ensures energy-efficient operation of the machine tool. Overall, different compressed air costs can be recorded and calculated to assess and organise energy-saving measures. Unnecessary costs due to leaks in standby mode are identified and comprehensively visualised.
The goal: transparent processes and the recording of energy consumption contribute to a sustainable “green” factory. Energy and operating costs are reduced and the compressed air resource is used efficiently.
Value proposition
|
|
|
|
How sustainable compressed air monitoring works
Compressed air is used in many areas of production and this results in extremely high costs due to the high consumption of the resource. Leaks, such as a small hole in the hose, result in significant financial costs if they are detected too late. The machines and systems must first be set up optimally. The same machines can even have different consumption levels. Every machine tool features simple display options that allow the various operating states to be easily identified. However, this does not include linking the compressed air consumption data with the corresponding cost information. This means that it is not possible to make an assessment within the framework of energy management and energy efficiency measures.
Compressed air monitoring with the IIoT platform moneo enables centralised monitoring and visualisation of the process values. The sensor values are recorded and converted into process-relevant information using data modelling. This data provides information about the consumption level and leaks.
Conclusion: Overall, system efficiency is optimised, leaks are detected early on and energy costs can be reduced sustainably.
moneo simulation video
Required interfaces for automated compressed air monitoring
The integrated solution of ifm sensors and the moneo software offers a variety of options and interfaces that support the automation of processes, thereby improving the entire supply chain process. Data processed in moneo can be output using various protocols. This makes it possible to send data to a third-party system via MQTT or OPC UA or to transfer it directly to AWS, Azure or the moneo Cloud via specific connections.

- moneo
MQTT or OPC UA →AWS, Azure, SAP - SAP Integration
SFI (shop floor integration) →SAP PM - Alarm
email notification (threshold) - Spare parts
automatic ordering through SAP - Cloud and on-premises
possible with the cloud and on-premises solutions
How to install sustainable compressed air monitoring
To determine the actual consumption of compressed air, moneo is installed. ifm provides a wide range of automation components. In this application, compressed air meters were installed at the compressed air inlet of the machine tool and upstream of the compressed air gun. The sensor data is provided to moneo RTM via an IO-Link master connected to the server via an internal network (VLAN). The compressed air consumption is then analysed according to the machine status. This forms the basis for organising energy efficiency measures. The cost of compressed air is also calculated from the time the application is put into operation.
The operating status (ON/OFF/standby) is monitored using the compressed air volume (flow). This means that conclusions can be made about the plant status using the air pressure and flow. The availability of the existing compressed air is determined via the sensor values. Based on the prepared historical data, conclusions can be drawn about anomalies in the process. Values that exceeded or fall short of the threshold can be detected at an early stage and alerts issued.
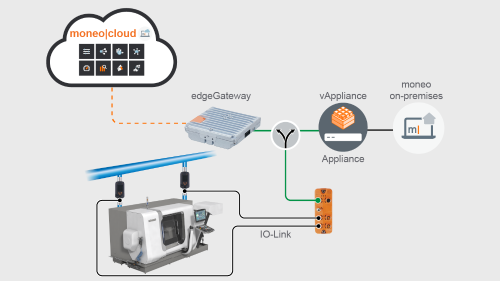
System structure
- IO-Link master
- Plug-in power supply
- Compressed air meters
moneo software
- Historical data
- Visualisation
- Monitoring
- Alarm function