Digital recording of electrical energy consumption

Pinpoint energy consumption and avoid reactive currents
Goal of the project
Electricity is used as drive power in many areas of production. However, without selective monitoring, the electrical energy requirement can only be determined as a total value and often cannot be attributed to the individual areas and systems in the process. The occurrence of reactive currents and reactive power often remains undetected.
For greater transparency of energy requirements and consumption, ifm uses high-quality sensors and the IIoT platform moneo. With the targeted use of an energy meter in conjunction with an interface – the ifm Agent – the data is first collected and forwarded to moneo. moneo then calculates the exact requirements and consumption of the individual applications in a machine tool. Energy consumption during a shift change and during downtime is also taken into account.
This allows necessary measures to be identified, energy resources to be used optimally and high costs to be avoided.
Transparent |
Identification of |
Prevention of |
|
On average, customers achieve: |
||
|
100% Cost and |
up to € 3,000 savings in personnel costs per |
up to 15 % cost savings with targeted |
Optimise energy use with transparency
moneo offers maximum transparency in locating and optimising electrical energy consumption. The energy meter records the consumption of electrical energy in the respective process-related work area and forwards this to moneo. moneo analyses and organises the recorded values and attributes them to the respective areas. This allows moneo to quickly and easily display energy consumption with maximum transparency. These measures not only make the data more accessible, but also make potential areas for optimisation clearly visible.
Energy transparency sustainably boosts awareness of actual electricity requirements and consumption. It forms the basis for responsible use of this resource and enables high cost savings to be achieved through appropriate measures.
Value proposition
|
|
|
|
How to detect and avoid reactive currents
In production, different applications such as drilling, milling, cooling lubricant supply and preparation, as well as compressed air and pneumatics are combined in machine tools. When using motors, pumps, chip conveyors and lighting and when programming and entering the workpieces to be manufactured, different consumption levels arise – including reactive currents.
To identify reactive currents, optimise electrical energy consumption and simultaneously save costs, determining the exact consumption of the individual applications is a must. This is where moneo comes into play. moneo enables data to be analysed and provides an accurate record of the electrical energy consumed in the scaled area.
Various consumption values are derived from the analysis, including:
- Total consumption
- Peak consumption
- Basic load consumption when the plant is in standby
- Consumption during the non-production period
- Reactive power generated
- Apparent power generated
For greater transparency concerning energy requirements and thus optimise energy consumption, precise recording and location of electricity requirements is a must. Courses of action can be developed and reactive currents and the associated high costs of excess energy consumption can both be avoided.
Data transfer via appropriate interfaces
The comprehensive solution of sensors combined with the IIoT platform moneo, offers many options and interfaces. The ifm Agent, an intelligent and universally applicable data interface that communicates data bidirectionally, is used to transfer data from the energy meter. The transferred data is analysed in the IIoT platform moneo. Most electricity meters are equipped with a Modbus TCP interface. The agent translates the protocol into a protocol used by the software.
The data processed in moneo can then be output via various protocols. For example, data can be transferred to a third-party system via MQTT or OPC UA or sent directly to AWS and Azure.
Energy consumption can be monitored in conjunction with the moneo Cloud.

- moneo
MQTT or OPC UA →AWS, Azure, SAP - Alarm
email notification (threshold) - Spare parts
automatic ordering through SAP - Cloud and on-premises
possible with the cloud and on-premises solutions
How to install your energy monitoring system
Installing a system for recording and locating your energy consumption is simple and straightforward with moneo. To record all the data for the energy requirement of the machine tool, a three-phase energy meter with Modbus TCP interface is installed and connected. The electrical energy is recorded via the TCP interface and forwarded by the ifm agent. The agent enables reliable reading of the necessary Modbus registers. moneo then monitors and analyses the values and directly calculates the resulting consumption costs, i.e. basic, total and peak consumption. Other factors such as shift changeover and downtimes are also included in the calculation.
This creates a great deal of transparency concerning the actual energy requirements of the individual components in a machine and helps to calculate energy requirements and plan the costs of production. Energy is no longer lost and unnecessary costs can be avoided.
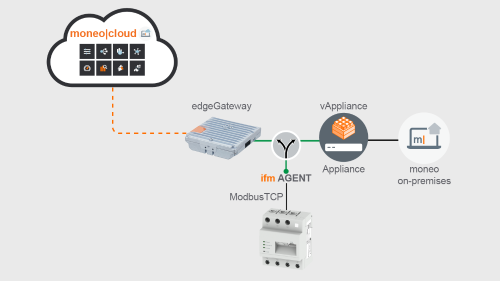
System structure
- Three-phase energy meter
(Modbus TCP interface) - ifm Agent
moneo software
- Historical data
- Visualisation
- Monitoring
- Alarm function
|
|
Additional product required three-phase energy meter with Modbus TCP interface |